

O primeiro trimestre de 2025 ofereceu um panorama mais complexo para o setor hoteleiro global. A análise revela um crescimento contínuo na satisfação global dos hóspedes, medida pelo Global Review Index™ (GRI). De fato, os níveis de satisfação ultrapassaram brevemente a marca de 86,41 pontos registrada em 2019 em junho de 2024.
Apesar da típica queda sazonal em janeiro, o forte desempenho, particularmente em março, impulsionou o GRI do primeiro trimestre de 2025 para 86,7%, o mais alto em quatro anos. No entanto, essa conquista positiva contrasta com o crescimento quase estagnado no volume de avaliações e com variações regionais significativas. Esta análise explora as tendências cruciais da experiência do hóspede no primeiro trimestre de 2025, dissecando os dados que impulsionam o desempenho.
GRI atinge novos patamares
A satisfação global dos hóspedes (GRI) cresceu pelo segundo ano consecutivo, demonstrando uma recuperação sustentada. O primeiro trimestre de 2025 registrou um aumento de 0,4 ponto percentual em comparação com o trimestre anterior. Explore todas as principais tendências e insights no mais recente Relatório de Benchmarking da Experiência do Hóspede da Shiji. aqui.
Crescimento do volume de avaliações vacila
No entanto, o cenário para o volume de revisões é menos robusto. Os três primeiros meses de 2025 apresentaram um crescimento de volume apenas ligeiro (+0,7%) em comparação com o primeiro trimestre de 2024. Isso é consideravelmente menor do que o crescimento de 2,2% registrado no primeiro trimestre de 2024 em relação ao primeiro trimestre de 2023. Diversos fatores provavelmente contribuíram para esse crescimento modesto. Por exemplo, uma queda de 3% na demanda global, influenciada pelo período do Ano Novo Chinês e pela desaceleração do turismo em importantes cidades europeias como Barcelona, teve um papel importante.
Areias Movediças: Análise do Desempenho da Fonte
Consequentemente, a geração de avaliações variou significativamente entre as fontes em comparação com o primeiro trimestre de 2024. Algumas fontes apresentaram declínios acentuados, notadamente Agoda (-16,6%) e TripAdvisor (-11,0%). Booking.com, que apresentou declínios ao longo de 2024, registrou uma queda de apenas 2,2%. Fontes menores, agrupadas como "Outras", perderam um volume substancial (-16,9% em comparação com o primeiro trimestre de 2024 e -23,5% em comparação com o primeiro trimestre de 2023). Por outro lado, outras plataformas apresentaram forte crescimento: Hotels.com teve um aumento de +38,2%, Expedia aumentou +27,0% e Trip.com cresceu +18,4%.
As pontuações departamentais mostram resultados mistos.
Apesar dos desafios de volume, as tendências de satisfação dos hóspedes foram positivas na maioria das plataformas. Todas as principais fontes, exceto o Google (-0,4 pontos), mostraram crescimento no GRI em comparação com o primeiro trimestre de 2024. Os principais índices departamentais também melhoraram nos últimos 15 meses (comparando o primeiro trimestre de 2025 com o primeiro trimestre de 2024): a limpeza aumentou significativamente (+1,8 pontos), os quartos melhoraram (+0,8 pontos) e o serviço subiu ligeiramente (+0,3 pontos). Apenas o índice de custo-benefício estagnou, caindo um pouco (-0,02 pontos) no mesmo período. As menções positivas também aumentaram, crescendo +1,0 ponto em relação ao ano anterior, atingindo 76,6%.
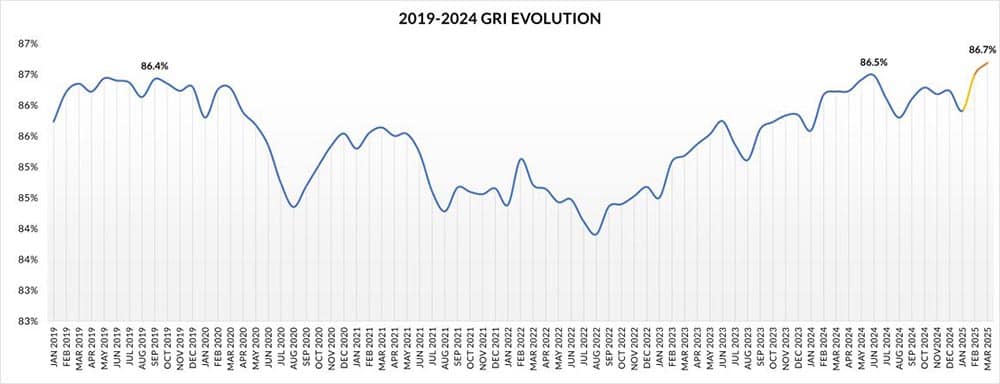
Evolução do Índice de Revisão Global (GRI), 2019 – 1º trimestre de 2025, atingindo o pico de 86,7% em março de 2025.
Eficiência do engajamento: resposta da gestão dispara
Além disso, os hotéis continuaram a aprimorar seu engajamento com as avaliações. A taxa de resposta da administração global apresentou um crescimento impressionante, aumentando 4,2 pontos percentuais e atingindo 69,21. A melhoria no tempo médio de resposta é ainda mais notável. Hotéis que antes levavam cerca de 6 dias para responder reduziram drasticamente esse tempo. A média global agora é de apenas 3,1 dias, provavelmente impulsionada pela adoção de ferramentas de inteligência artificial. No entanto, a tendência negativa no índice de custo-benefício em muitos mercados merece atenção, visto que a incerteza do mercado pode aumentar a sensibilidade aos preços.
Análises Regionais Detalhadas
Ásia
A Ásia continua sendo a região com melhor desempenho, com base no GRI, para hotéis de 3, 4 e 5 estrelas. No entanto, foi uma das duas únicas regiões onde o volume de avaliações caiu (-1,9% em comparação com o 1º trimestre de 2024). Essa queda foi impulsionada principalmente pela diminuição do volume no Google (-13,7%) e no Agoda (-12,1%). Notavelmente, isso marca a primeira queda global no volume do Agoda nessa região em três anos (exceto na Oceania, onde cresceu +11,3%). O segmento de 5 estrelas da região apresentou sinais de desaceleração, com crescimento do GRI (+0,2 pontos) ligeiramente abaixo da média regional (+0,4 pontos) e pequenas quedas nos índices de Serviço (-0,1 pontos) e Custo-benefício (-0,4 pontos).
Europa
O mercado europeu apresentou um desempenho sólido. O GRI aumentou 0,5 pontos em comparação com o primeiro trimestre de 2024, e o volume de avaliações cresceu 2,21 trilhões. Esse crescimento ocorreu apesar das quedas significativas do TripAdvisor (-8,81 trilhões), HolidayCheck (-12,51 trilhões) e Agoda (-31,61 trilhões). O Booking.com continua a dominar o mercado com uma participação de 64,41 trilhões, seguido pelo Google com 18,51 trilhões. Assim como na Ásia, os hotéis 5 estrelas na Europa mostraram sinais de pressão. Em comparação com o primeiro trimestre de 2024, os índices de 5 estrelas diminuíram em Serviço (-0,2 pontos), Limpeza (-0,4 pontos), Quarto (-0,8 pontos), Custo-benefício (-0,2 pontos) e Alimentos e Bebidas (-0,8 pontos).
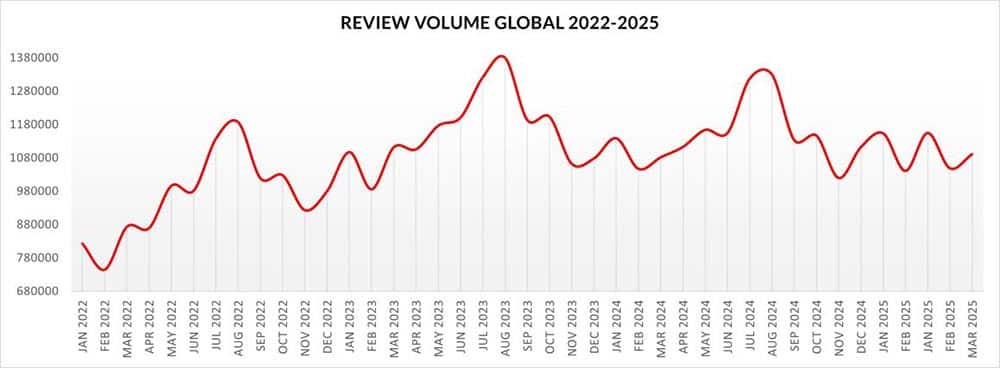
O volume global de avaliações (2022-1º trimestre de 2025) apresenta picos sazonais, mas o ligeiro aumento no início de 2025 reflete o crescimento mais lento observado no parâmetro de referência do 1º trimestre de 2025.
América latina
Este mercado enfrentou desafios no primeiro trimestre de 2025. O crescimento do GRI estagnou (+0,1% em comparação com o primeiro trimestre de 2024) e o volume de avaliações diminuiu significativamente (-4,2%). Essa perda de volume resultou de tendências negativas generalizadas nas principais fontes: Agoda (-59,2%), Trip.com (-29,2%), TripAdvisor (-13,2%), Google (-9,9%) e Booking.com (-1,5%). Apesar dessas dificuldades, a porcentagem de menções positivas aumentou 0,6 pontos percentuais, chegando a 73,8%. Além disso, a taxa de resposta às avaliações subiu consideravelmente, 7,7 pontos percentuais, atingindo 69,5%.
África
A África foi a única região com tendência negativa no Índice de Rendimento Global (GRI) neste trimestre (-0,21 TP442T em comparação com o 1º trimestre de 2024), principalmente devido ao desempenho na categoria de 4 estrelas (-0,4 pontos). Em contrapartida, registrou um forte crescimento no volume de avaliações (+6,91 TP442T). No entanto, os principais indicadores de desempenho apresentaram queda em relação ao 1º trimestre de 2024: o Serviço caiu 0,4 pontos, o Valor 0,5 pontos e a Limpeza 1,1 pontos. O aumento no volume de avaliações possivelmente contribuiu para uma leve queda na taxa de resposta, que diminuiu 0,7 pontos, para 71,11 TP442T. Curiosamente, o crescimento global positivo do HolidayCheck (+14,61 TP442T) foi impulsionado quase que inteiramente pelo seu desempenho na África (+43,01 TP442T), já que estagnou ou apresentou queda em outras regiões.
Médio Oriente
Esta região apresentou uma divergência significativa de desempenho entre hotéis 5 estrelas e outras categorias. O crescimento geral do GRI no primeiro trimestre (+0,4% em comparação com o primeiro trimestre de 2024) foi impulsionado principalmente por hotéis 4 estrelas (+0,8 pontos), o dobro da taxa de crescimento das propriedades 5 estrelas. O volume de avaliações cresceu minimamente (+0,4%), o que é baixo para o que normalmente é alta temporada. Os fatores que contribuíram para isso incluem perdas significativas de volume de Agoda (-43,9%), HolidayCheck (-22,9%), TripAdvisor (-16,4%) e Booking.com (-10,4%). Em contraste, o volume de Hotels.com cresceu substancialmente (+34,4%). De forma encorajadora, a taxa de resposta às avaliações continuou a subir, aumentando 4,3 pontos para um impressionante 83,1%.
América do Norte
A América do Norte manteve o bom momento de 2024 no primeiro trimestre de 2025. O GRI apresentou um forte crescimento (+0,7 pontos em relação ao primeiro trimestre de 2024), juntamente com um robusto aumento no volume de avaliações (+6,3%). Esse aumento de volume foi impulsionado pelo desempenho positivo do Google (+3,5%), Expedia (+28,4%) e Hotels.com (+37,3%). Como resultado, o Expedia agora detém mais de 30% (31,2%) da participação de mercado de avaliações. Enquanto isso, o Booking.com perdeu 2,7 pontos percentuais, fechando em 24,0%. Assim como em outras regiões, o segmento de 5 estrelas mostrou sinais de desaceleração. As pontuações do índice de hotéis cinco estrelas caíram em comparação com o primeiro trimestre de 2024 em Limpeza (-1,1 pontos), Quarto (-1,5 pontos) e Custo-benefício (-1,3 pontos).
Oceânia
A alta temporada na Oceania coincidiu parcialmente com o primeiro trimestre, mas o desempenho permaneceu positivo. O GRI cresceu 0,6 pontos em comparação com o primeiro trimestre de 2024, e o volume de avaliações aumentou em 4,61 trilhões. A maioria das principais fontes apresentou crescimento; apenas o TripAdvisor (-23,61 trilhões) e o HolidayCheck (-25,91 trilhões) registraram quedas. No entanto, a região está atrasada em termos de engajamento com as avaliações. Sua taxa de resposta da administração é relativamente baixa, de 55,41 trilhões, em comparação com a média global próxima a 701 trilhões. Além disso, seu tempo médio de resposta ainda gira em torno de 4 dias, enquanto a maioria dos outros mercados tem uma média inferior a 3,5 dias.
Conclusão
Em resumo, o primeiro trimestre de 2025 confirmou a capacidade do setor hoteleiro de aumentar a satisfação dos hóspedes além dos níveis pré-pandemia. As categorias de hotéis de luxo contribuíram positivamente para essa tendência. Padrões claros e distintos, liderados por tendências regionais, também são evidentes, marcando uma mudança em relação à fase de recuperação pós-pandemia, mais variável.
Embora o crescimento mínimo no volume de avaliações seja um ponto a ser observado, as melhorias observadas em fevereiro e março representam um sinal potencialmente positivo. Indicadores operacionais importantes, como limpeza, acomodação e serviço, apresentaram melhorias significativas nos últimos 15 meses. No entanto, a estagnação do índice de custo-benefício é um ponto crítico a ser considerado. A maior sensibilidade aos preços, potencialmente exacerbada pelos recentes desdobramentos das tarifas de comércio internacional, pode representar um desafio para o setor hoteleiro.
Portanto, o próximo trimestre, que inclui os principais feriados, testará rigorosamente a capacidade do setor de manter a satisfação do cliente, gerenciando, ao mesmo tempo, a percepção de valor. Continuar monitorando essas tendências de experiência do cliente será essencial.
Mais dicas para expandir seus negócios
Revfine.com é a plataforma de conhecimento líder para a indústria de hospitalidade e viagens. Profissionais usam nossos insights, estratégias e dicas práticas para se inspirar, otimizar receita, inovar processos e melhorar a experiência do cliente.Explore conselhos de especialistas sobre gestão, marketing, revenue management, operações, software e tecnologia em nosso dedicado Hotel, Hospitalidade, e Viagem de Turismo categorias.


Leave A Comment