
Data analytics is, of course, helpful to better understand your hotel’s direct channel performance, but what’s most useful is being able to compare your results to the market to identify potential growth drivers.
The Benefits of Hotel Benchmarking
Hotel benchmarking enables you not only to access competitive insights but to make better-informed decisions and take action in those areas that will impact your business. Knowing which metrics to focus on, however, can sometimes be challenging…
Today, we will introduce four key metrics to benchmark your hotel’s direct channel performance and explain how to interpret them and improve your results. It’s important to note that these metrics are just a starting point. To further explore other relevant KPIs and growth strategies, download our comprehensive 10 Direct Channel KPIs ebook.
4 Key Metrics for Your Hotel’s Direct Channel Success
Below you will find four key metrics for your hotel’s direct channel success. So you can compare your results to the market.
1. Website Conversion Rates
1.1 Total Conversion Rate
Looking at the direct bookings made on your hotel’s website, the total conversion rate compares the number of bookings received during a specific time period to the number of website visitors. The average hotel rate is around 2%, meaning that roughly 98 of every 100 visitors leave the website without completing a reservation. This presents a significant opportunity as you can increase revenue without additional marketing spending by concentrating your efforts on improving this metric.
1.2 Visitor to Booking Engine (BE) Conversion
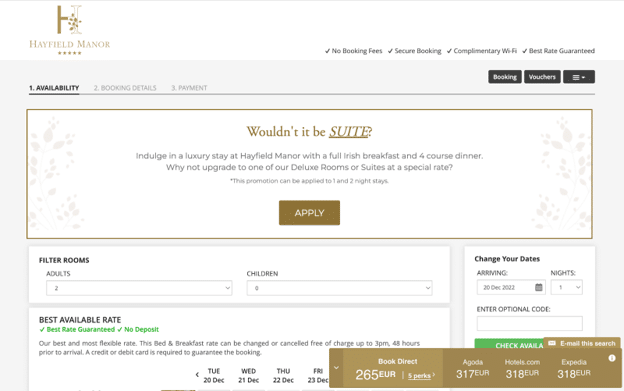
A key indicator to understand your booking funnel performance is the Visitor to BE Conversion. Typically ranging between 35% and 55% on average, it measures the percentage of total website visitors who search your booking engine. To improve these numbers, it is recommended to display personalized messages and offers on your hotel’s homepage, including a clear call-to-action (CTA) redirecting visitors to the booking engine.
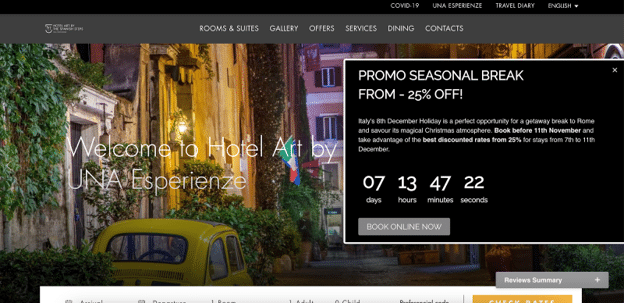
A message with a countdown on the Homepage redirecting to BE
1.3 Booking Engine (BE) to Booking Conversion
Defined as the average conversion rate of users searching on the booking engine who end up booking, this rate is usually lower than Visitor to BE conversion, ranging from 5% to 15%. An effective tactic to boost performance at this stage in the funnel is to show an exit message to retain users who are about to leave your website. It’s the perfect opportunity to grab the user’s attention with a personalized message, including an exclusive discount or another appealing incentive to convince them to book directly with you.
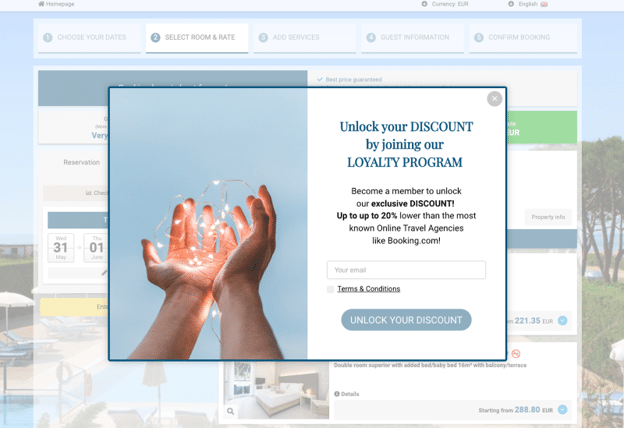
Email capture message displayed on exiting the BE
2. Disparities Frequency
Disparities frequency refers to the average percentage of times when hotel rates are undercut by online travel agencies (OTAs) during a specific period. The rate can vary in different markets and OTAs, with an average range of 10-30%. It’s critical to reduce disparities as much as possible since being able to find cheaper rates elsewhere can greatly decrease the bookings made through your website. An effective way to combat disparities is using Price Match, which allows you to automatically display an equivalent offer to users on your website when your rates are undercut for a specific search.
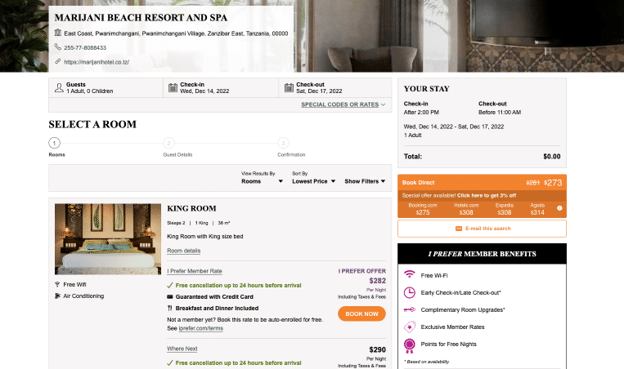
Price Match tool embedded in the BE page
3. RevDirect
The Revenue Per Available Room for your direct channel, also known as RevDirect, divides the total direct room revenue by the number of available room nights (based on stay dates). Focusing on increasing RevDirect will help you boost the revenue per available room for your direct channel. This can be achieved by looking at stay dates and growing direct room revenue using relevant and timely special offers or packages.
Message upselling to a higher-value package
4. Direct Booking Index (DBI)
This is a nifty metric as it measures the effectiveness of your hotel’s direct channel strategy compared to the market as a whole. It’s calculated by weighing different aspects of a hotel’s direct channel strategy using an algorithm, allowing hotels to track their performance over time monthly.
The results range from 0 to 100 points, with 100 being the highest score possible. A strong DBI is considered to be above 50, which means the hotel’s performance in terms of its direct channel strategy is in the upper half of the market.
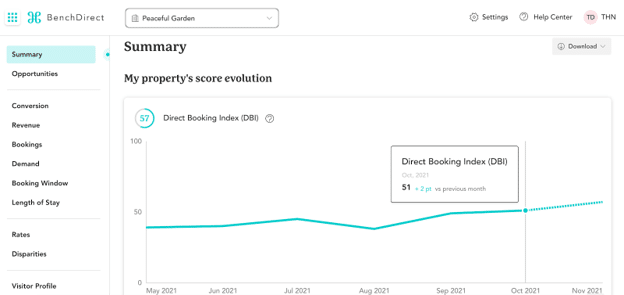
An example of the Direct Booking Index
Performance indicators provide the most valuable insights compared to the rest of the market or direct competitors. This article aims to provide you with a framework of KPIs specifically related to your hotel brand’s direct channel so you can benchmark your performance and put your team on the path to success.
More Tips to Grow Your Business
Revfine.com is the leading knowledge platform for the hospitality and travel industry. Professionals use our insights, strategies, and actionable tips to get inspired, optimize revenue, innovate processes, and improve customer experience.Explore expert advice on management, marketing, revenue management, operations, software, and technology in our dedicated Hotel, Hospitality, and Travel & Tourism categories.


Leave A Comment