

Average Rate Index (ARI) compares your hotel’s Average Daily Rate (ADR) with an aggregated competitive benchmark. It shows whether you are pricing above or below the market, but a higher ARI is only valuable when the occupancy trade-off still produces strong Revenue per Available Room (RevPAR).
Key Takeaways:
|
Table of Contents:
What Is Average Rate Index (ARI) in Hotels?
ARI answers one question. For every unit of rate your market captures, how much do you capture?
CoStar and STR define the metric as a measure of a hotel’s ADR performance relative to an aggregated group of hotels, whether that group is your competitive set, your submarket, or your full market. An index of 100 is the reference point, described in CoStar’s benchmarking glossary as fair share: the score a property is expected to reach when all else is equal. Anything above 100 represents more than its expected share of that group’s rate performance.
ARI is deliberately narrow. It says nothing about how many rooms you sold, and nothing about what those rooms cost you to service. Stripping occupancy out is the point. You get to see your pricing position before volume noise distorts it.
How Do You Calculate ARI?
The Average Rate Index (ARI) formula is:
ARI = Hotel ADR / Competitive Set ADR x 100
CoStar gives a worked example in which a hotel at $60 ADR against a $50 competitive benchmark produces an ARI of 120. A $40 ADR against the same benchmark produces an ARI of 80.
Apply it to a 90-room boutique in Lisbon’s Chiado district. March ADR of 178 euros against a comp set ADR of 165 euros gives an ARI of 107.9, a rate premium of roughly 8 percent over the properties it loses bookings to.
The failure mode is calculating it once a year and filing it. A combined annual score of 100 can conceal a midweek ARI of 88 and a weekend ARI of 114, two different commercial problems with two different fixes. One number for the year tells you nothing you can act on.
Run the index monthly at minimum, then split it by day of the week and by segment. Corporate Tuesdays and leisure Saturdays sit in different rate positions.
What Is a Good ARI Score for Your Hotel?
There is no universal target. The right ARI score depends on your product and your commercial model.
If your rooms were renovated last year and your competitors’ were not, any score below 100 is a leak you are funding. If you run 400 rooms on an airport volume model, an ARI of 95 with a strong occupancy index can be exactly the position you want.
The research points one way. In Competitive Hotel Pricing in Uncertain Times, Cornell researchers Cathy Enz, Linda Canina and Mark Lomanno examined 67,008 hotel observations from 2001 through 2007 and argue that hotels priced above their competitive set recorded lower occupancy but higher RevPAR (Revenue Per Available Room, sometimes called yield per room) than hotels priced below it. Their study is published by Cornell’s Center for Hospitality Research.
Linda Canina, an associate professor at the Cornell University School of Hotel Administration, summarized a later pricing study this way:
“The strategy of shifting to higher prices relative to competitors was the most successful,” as reported in the Center for Hospitality Research announcement.
The discounting debate remains contested, and these figures describe averages across a large sample rather than your property. Treat a persistent ARI below 100 as a decision you are making, not a condition you inherited.
The ARI Position Grid
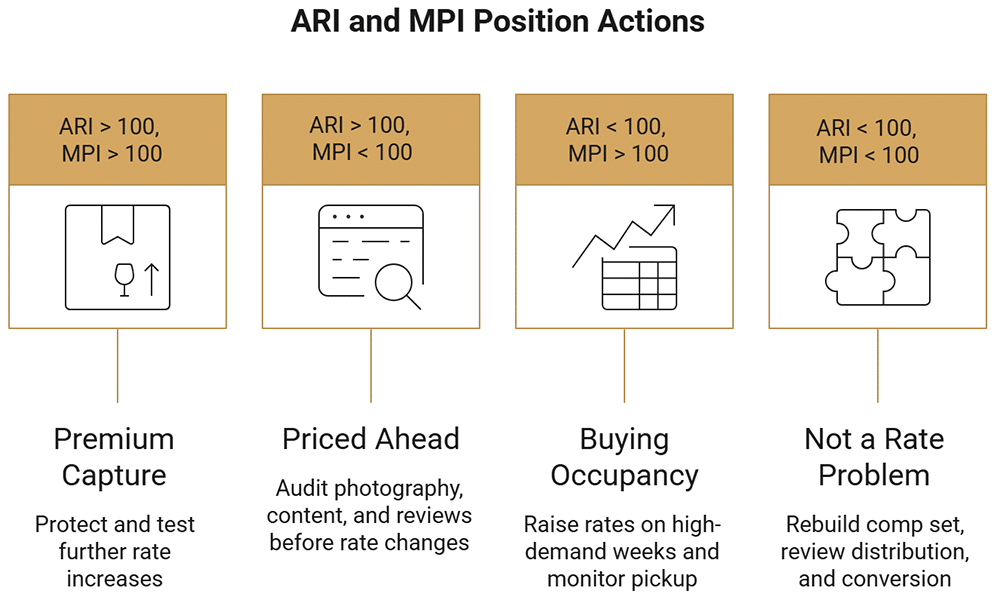
ARI on its own is half a read. Pair it with Market Penetration Index (MPI), which does the same job for occupancy, and four positions emerge, each pointing to a different first action.
MPI (Market Penetration Index): Measures occupancy performance against your competitive set.
Formula: MPI = (Your Occupancy / Comp Set Occupancy) x 100RGI (Revenue Generation Index): Measures RevPAR performance against your competitive set.
Formula: RGI = (Your RevPAR / Comp Set RevPAR) x 100
| Position | What It Signals | What To Do First |
| ARI above 100, MPI above 100 | Premium capture. Product and demand generation both hold. | Protect it. Test a further 2 to 3 percent rate move on your ten strongest dates. |
| ARI above 100, MPI below 100 | Priced ahead of product, or a value gap guests can see. | Audit photography, content, and review scores before touching rate. |
| ARI below 100, MPI above 100 | Buying occupancy. Volume you may have won at a higher rate. | Raise rate on your three highest-demand weeks and watch pickup pace daily. |
| ARI below 100, MPI below 100 | Not a rate problem. Look at distribution, product, or comp set definition. | Rebuild the comp set, then review channel mix and conversion. |
That third row costs more than it did. CoStar and Tourism Economics lifted their 2026 U.S. occupancy projection to 63.1 percent and raised projected ADR gains, with STR president Amanda Hite stating in the August 2026 forecast release that “top-line growth will still be driven by ADR.”

Chaya Kowal, Director of Revenue Management, Potato Head Family“To start with, I believe your pricing analysis should always begin with your own product and positioning. Every hotel is different, and before looking outside, you need to understand how guests are perceiving your value. Your guest satisfaction scores, reviews, and direct feedback are your first indicators. Are you consistently delivering on your brand promise? I always say: aim to be better than yesterday, every single day. Once you’re clear on your internal performance and guest perception, then bring in market and competitor insights. One of the main tools I use is STR. While it’s not always an apples-to-apples comparison, it still offers strong benchmarking through key indexes like RGI, ARI, and MPI. These help you understand if you’re gaining fair market share, if your rate is competitive, and how you’re pacing in terms of occupancy.” Click here to learn more from our Hotel Marketing Expert Panel. |
In a rate-led market, discounting into occupancy you already held costs you twice. Read your “Revenue Generation Index (RGI)” alongside both indexes to confirm which one moved the outcome.
Why Does Your Comp Set Decide Your ARI?
ARI is a positioning metric, not a verdict. Every score depends on the hotels in the denominator, so changing the competitive set can change your ARI even when your own ADR stays exactly the same.
CoStar’s STR Benchmark guidelines require at least four participating properties beyond the subject hotel. They also limit any single property to 50% of participating room supply within the set. These rules protect benchmarking integrity, but they do not guarantee that every hotel competes for the same demand as yours.
A mathematically correct ARI can still answer the wrong question.
Review your comp set when properties open, close, renovate, rebrand, or reposition. A competitor selected three years ago may now sit in a different price tier or attract a different guest segment.
For an independent hotel, this matters even more. If a credible direct comp set is not available, a market, submarket, or class benchmark may provide a more useful reference than forcing unrelated hotels into the comparison.
What Should You Do When Your ARI Drops?
A falling ARI is a question, not a verdict. Your ADR may have fallen, or your competitors may have raised faster than you did, and those two situations call for opposite responses.
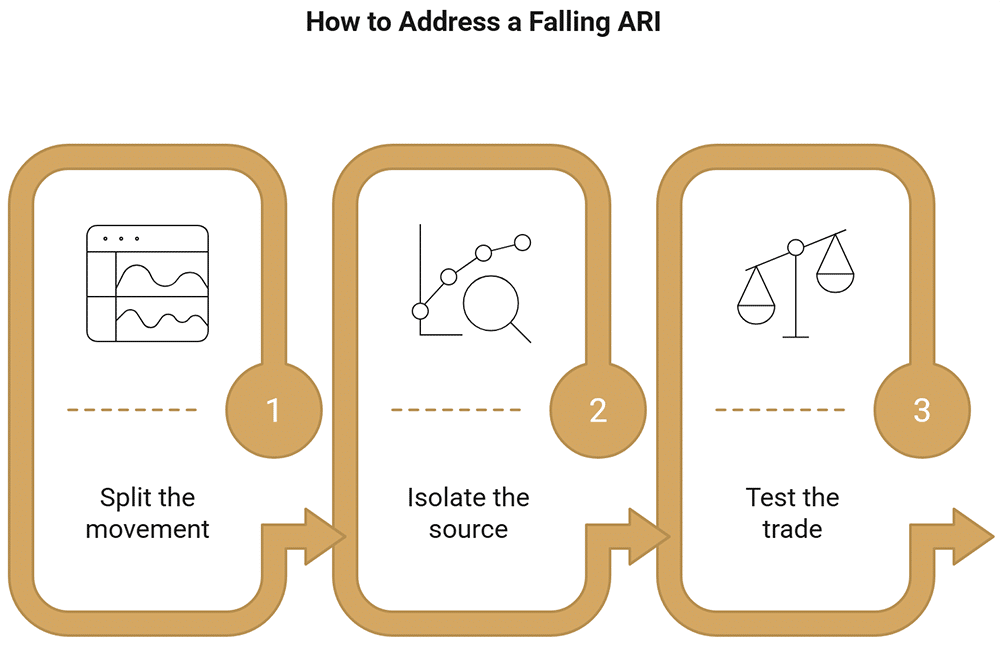
Work through the movement in sequence before you touch the rate structure.
| Step | What You Check | What It Rules Out |
| 1. Split the movement | Your ADR month over month against your comp set ADR | A decline caused entirely by competitors raising rates |
| 2. Isolate the source | ARI by date, segment, and room type | A structural rate problem when one segment moved |
| 3. Test the trade | RGI for the same period | A deliberate rate position that is working |
Market rate has been moving under everyone. U.S. ADR reached $171.74 in July 2026, up 5.7 percent year over year against a 2.3 percent occupancy gain, according to CoStar’s July 2026 performance release. Holding your rate flat in a market climbing at that pace produces an index decline with no decision behind it.
Where you act matters as much as whether you act.
Leah McFarland, senior vice president of revenue strategy at Crestline Hotels & Resorts, described the 2026 approach as being “very micro-focused on strategy, particularly rate strategy, from one market to the next” in CoStar’s report on revenue manager planning.
For a 70-room independent hotel, that means fixing weak Tuesdays rather than cutting Friday and Saturday rates because one monthly average slipped.
How Should Independent Hotels Use ARI?
Independent hotels should use ARI to test pricing power, not copy competitor rates. You rarely have the brand reach, loyalty base, or cluster revenue resources available to a large chain, so a high-rate strategy needs stronger evidence that guests will accept the premium.
Cornell’s European hotel research found the positive relationship between higher relative pricing and relative RevPAR was stronger for chain-affiliated properties than for independents.
For an independent property, review ARI at the level where you can act:
- Weekday versus weekend
- High-demand versus need dates
- Room type
- Corporate, group, and leisure segments
- Direct versus commissionable distribution
Consider a 55-room independent hotel with ARI of 108 for the month but 92 on Tuesday and Wednesday. Your problem is not the property’s overall rate strategy.
Protect the days where guests already accept your premium. Fix the periods where your rate position and RGI show a genuine gap.
FAQs About Average Rate Index (ARI)
Average Rate Index shows whether your ADR sits above or below your competitive benchmark, but higher is not automatically better. Read ARI with MPI and RGI so you can protect justified rate premiums, identify weak demand periods, and avoid sacrificing RevPAR simply to maintain a higher rate position.
Did You Like This Article About Average Rate Index (ARI) in Hotels?
You might also be interested in the following articles:
- What Is RevPAM in Hotels and How Do You Calculate It
- What Is an Average Daily Rate (ADR)?
- What Is eNPS in Hotels? The Metric That Predicts Turnover
More Tips to Grow Your Business
Revfine.com is the leading knowledge platform for the hospitality and travel industry. Professionals use our insights, strategies, and actionable tips to get inspired, optimize revenue, innovate processes, and improve customer experience.Explore expert advice on management, marketing, revenue management, operations, software, and technology in our dedicated Hotel, Hospitality, and Travel & Tourism categories.
This article is written by:

Hi, I am Martijn Barten, founder of Revfine.com. With 20 years of experience in the hospitality industry, I specialize in optimizing revenue by combining revenue management with marketing strategies. I have successfully developed, implemented, and managed revenue management and marketing strategies for individual properties and multi-property portfolios.




Leave A Comment