
Calculate RevPAR for strategic optimization and success. It’s a common mantra within the hospitality sphere. However, your Revenue Per Available Room (RevPAR) involves more than you might think, and every variable impacts your potential profit. RevPAR is a metric that explains your hotel’s performance and helps identify areas for optimization and revenue growth.
In this article, you’ll discover the basics of RevPAR calculations and how to use the results to grow your business toward a successful future.
Table of Contents:
- What is RevPAR?
- Why is RevPAR Important in the Hotel Industry?
- How to Calculate RevPAR Effectively
- How Frequently Should You Review Your RevPAR?
- RevPAR vs ADR: What’s the Difference?
- What is the RevPAR Index?
- How to Calculate the RevPAR Index
- Strategies to Increase RevPAR at Your Hotel
- What Does Low RevPAR Mean?
- What Does High RevPAR Mean?
- What is a Good RevPAR?
- RevPAR-Related KPIs
- Alternatives to RevPAR
- Common Mistakes to Avoid When You Calculate RevPAR
- The Most Used Revenue Management KPIs for Hotels
- Revenue Management Trends: Latest Developments
What is RevPAR?
RevPAR can seem intimidating, but the foundational elements are quite simple. RevPAR is simply the revenue per available room. This is, in turn, discovered by using your average daily rate (ADR) with your occupancy rate. In other words, RevPAR is a metric that measures your property’s profitability and optimization. The better your RevPAR, the better your property’s overall financial health. It’s also one of the most reliable predictive measures for your long-term growth, benchmarking, and overall revenue management. The numbers show you where you currently are and where you’ll be at any given point in the future if conditions remain stable. This will then give you the power to plan and further optimize. If you want to find more information about RevPAR, read “What is RevPAR?”
Video: RevPAR Calculation and Explanation
Why is RevPAR Important in the Hotel Industry?
The importance of measuring RevPAR comes from both accuracy and scope. Metrics tend to focus on singular elements rather than a broader picture. However, when you calculate RevPAR, you’re integrating both pricing and occupancy to create a larger picture of the property’s performance. By doing so, you’re then able to use the information as a guide to plan effective, logical, demand-based pricing strategies. For example, you can use RevPAR to discover what times are truly high and low-performing and then adjust your marketing accordingly. Likewise, the solid metrics make it easy to perform fair evaluations between your property’s performance and that of the competition.
How to Calculate RevPAR Effectively
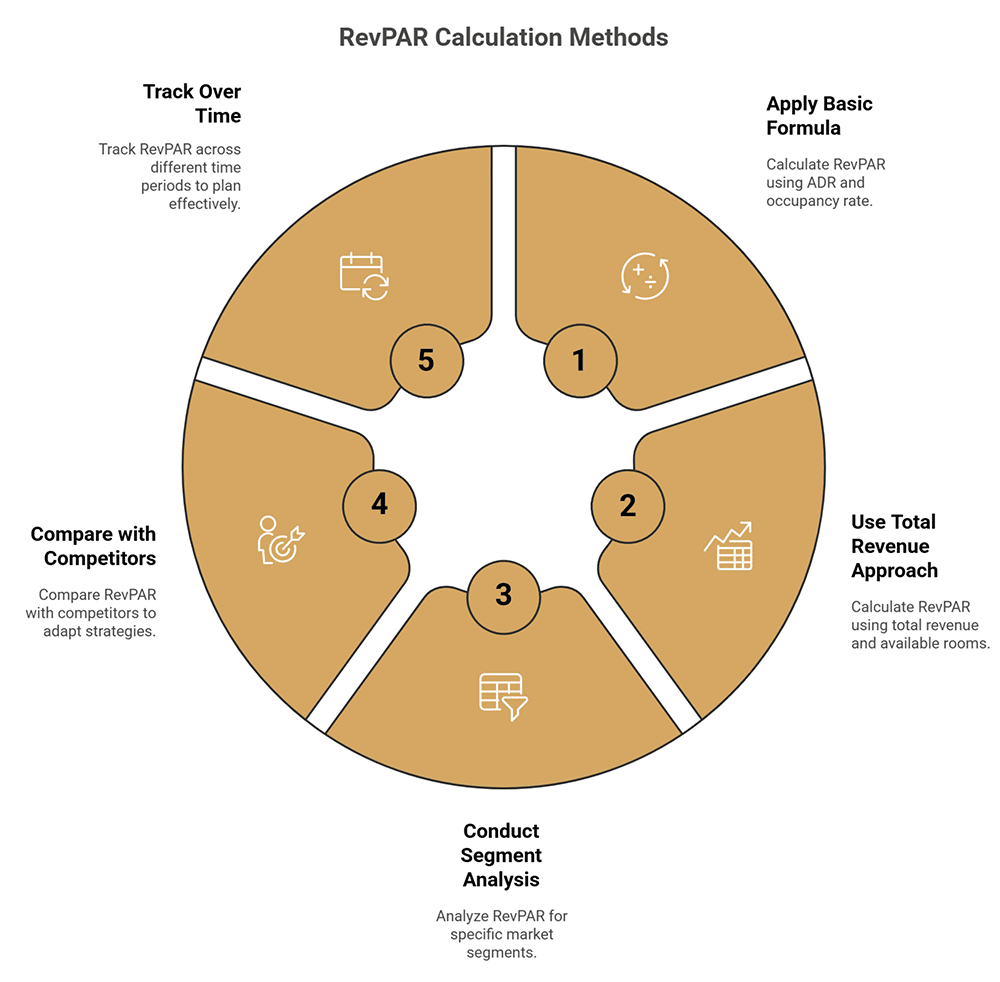
Learning to calculate RevPAR is an essential part of optimizing your hotel’s business strategy. The following five options are the best methods to do so.
1. Basic RevPAR Formula Application
You can easily calculate RevPAR through a simple equation that multiplies the Average Daily Rate (ADR) by the occupancy percentage.
RevPAR = ADR × Occupancy Rate
In other words, consider a situation where you had an ADR of $185 and an occupancy rate of 68%. You’d plug in the values and get $185 × 0.68, which is a RevPAR of $125.80. This method is quick and simple, which makes it ideal for weakly, daily, or off-the-cuff analysis of your property’s overall performance.
2. Total Revenue Approach
You can also perform a RevPAR calculation by using total room revenue divided by total available rooms.
RevPAR = Total Room Revenue ÷ Total Available Rooms.
For example, with a monthly room revenue of $450,000 and 120 rooms available for 30 days (3,600 room nights), you would have a RevPAR of $125. The major benefit of the total revenue approach comes from its applicability to extended periods or inconsistent ADR and occupancy data. It’s a measure with more clarity toward revenue efficiency with the total inventory capacity of your property. When you calculate revenue per available room you cut through potentially inconsistent records.
3. Segment-Specific RevPAR Analysis
How to calculate RevPAR often changes depending on which elements take priority within your business. For example, you might need to investigate which market segments to target for optimal performance. You’d begin by first separating room statistics and revenue into subcategories based on your market segments. You would then proceed to use the standard techniques to calculate RevPAR for those individual segments. This methodology can help you hone in on the high-value components and optimize your resource allocation.
4. Competitive Set Comparison
RevPAR metrics calculation is a powerful tool that can help you stay ahead of the competition. Industry services like STR or even hotel associations in your area can supply you with information on the revenue per room metrics for the competition. The revenue per room performance information is hard data that shows potentially hidden elements of the market. You can calculate RevPAR scores to compare your performance to those of your most similar competitors. This can help you adapt your business strategy to the hospitality industry’s ever-changing landscape.
5. Time-Period RevPAR Tracking
You can also separate your data by time periods such as the day, week, month, and year. These time-period RevPAR values can highlight variation that regularly occurs during different periods. You might see predictable changes occurring during different seasons, holiday periods, etc. When you calculate RevPAR by time period, you’ll be able to plan better for the future and take advantage of these patterns. For example, you might increase staffing when your data suggests a sudden spike in guest activity. This helps you allocate resources to maximize profit. Being able to understand when you need to prepare for different conditions means being able to intelligently use your existing resources in an optimal manner.
How Frequently Should You Review Your RevPAR?
You should always calculate RevPAR on a regular basis, as its importance is tied to the use of up-to-date information. It’s generally advantageous to calculate your RevPAR on a yearly, monthly, weekly, or even daily basis, as this can provide you with unique insights. When you calculate your RevPAR on a short-term basis, you’re able to quickly adapt to market changes in a timely manner. This allows for more agile responses to situations that require immediate action. Quarterly, annual, and monthly calculations can highlight specific seasonal trends or predictable market fluctuations. Balancing both techniques gives you a powerful view of trends on both a short-term and long-term scale. You can also include different stakeholders pulled from sales or different management areas to help keep everyone on the same page.
RevPAR vs ADR: What’s the Difference?
RevPAR and ADR are both important calculations that can improve the profitability of your property, but they’re also distinct. A revenue per available room calculation gives you an overview of both the property’s occupancy and pricing. This metric lets you see the revenue of each room while utilizing occupancy values. ADR (Average Daily Rate) is the average total of how much an occupied room earns. The ADR value is essentially what guests pay per night for a room. RevPAR takes a room’s state of occupancy into account and, in doing so, creates a fuller picture with more potential for actionable strategies. However, calculating ADR can also highlight accessibility or demand issues if it’s high and the RevPAR is low. ADR plays a major role in pricing strategy. Learn how it works in “What is an Average Daily Rate (ADR)?”
Video: Difference Between ADR and Revpar
What is the RevPAR Index?
RevPAR lends itself extremely well to other data points. One example is the RevPAR Index, also known as the Revenue Generating Index (RGI). The RGI is a comparative value, expressed as a percentile, that describes how your RevPAR holds up relative to that of a competitive set. A percentile value of 100% indicates perfect parity between your property and a competitor. Likewise, when the percentile rises above 100%, you’re outperforming the competitive set, while sitting below that mark indicates underperformance. You should always view these variables as markers of a larger strategy. If you’re underperforming, that means you’re probably missing some key elements that could improve your profitability.
How to Calculate the RevPAR Index
Calculating your RevPAR Index is more difficult than just working with RevPAR, but not to the extent you might imagine. Just follow the steps below to calculate your RevPAR Index.
Calculate your RevPAR using the standard formula:
RevPAR = Total Room Revenue ÷ Number of Available Rooms.
Create and merge your competitive set: This data is typically gathered from multiple sources such as Smith Travel Research (STR), industry dashboards, local resources, benchmarking systems, and more.
Use the RevPAR Index Formula:
RevPAR Index = (Your Hotel’s RevPAR ÷ Competitor Set’s Average RevPAR) × 100
Here’s an example of how you could put this into practice if you had calculated your RevPAR as $128 and that of your competitive set at $115.
RevPAR Index = (128 ÷ 115) × 100 = 111.30
In that example, you’d be performing 11.3% better than the market average, given that 100% is parity. By continually tracking these numbers, you can graph market share and the relative success of different campaigns or policies.
Strategies to Increase RevPAR at Your Hotel
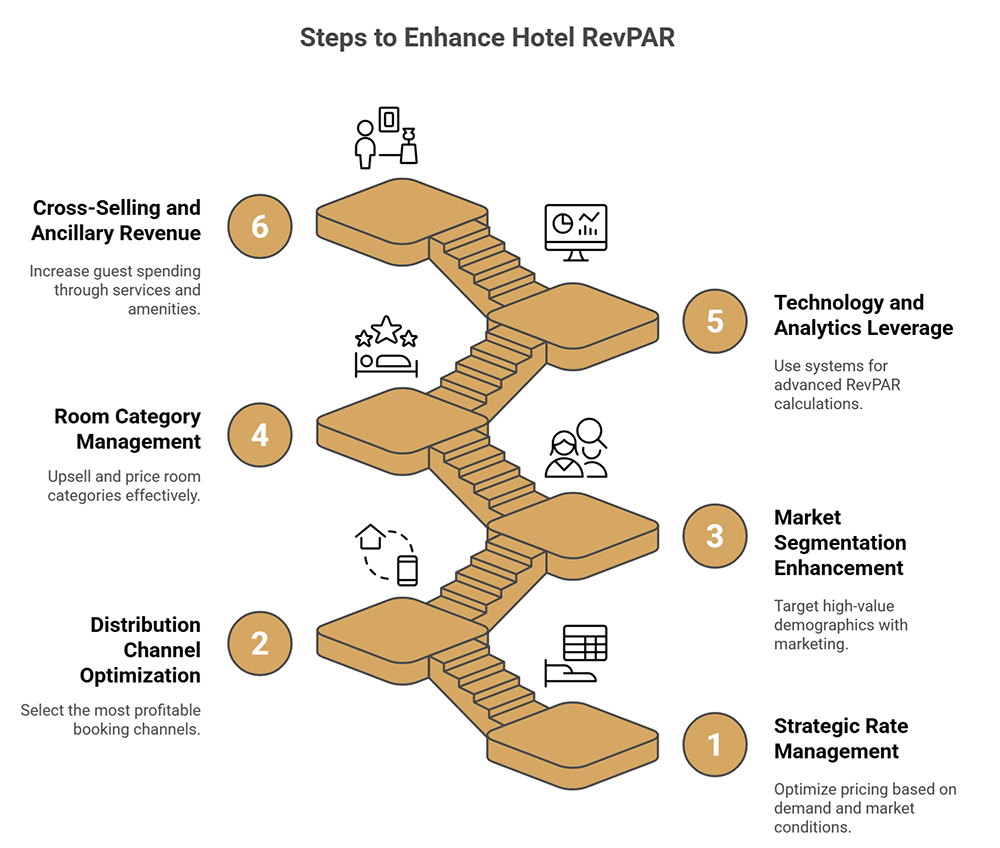
Calculating RevPAR is just one step in strategically leveraging it. The following concepts will help you turn an understanding of RevPAR into a successful plan to improve it.
- Strategic Rate Management: Study how your price adjustments relate to occupancy, as demand forecasts, marketing conditions, and booking windows can all be optimized according to RevPAR for maximized profits.
- Distribution Channel Optimization: After considering the acquisition costs, consider how different booking channels would provide the highest RevPAR. Judging the channels by RevPAR contribution can help you define the best distribution partners and the best resulting ROI.
- Market Segmentation Enhancement: Create targeted marketing campaigns directed at your higher-value demographics. A calculation of RevPAR by segment can help to improve your business composition.
- Room Category Management: You can optimize your overall revenue stream through upselling and specific pricing of room categories. This leverages your current inventory and shows existing opportunities to improve daily rates, without impacting occupancy.
- Technology and Analytics Leverage: Revenue management systems can be used to help calculate RevPAR implications through more advanced calculations and predictive systems for optimized pricing.
- Cross-Selling and Ancillary Revenue: Services, amenities, and experiences can all help to increase your overall guest spending, which increases room rates and indirectly impacts total RevPAR.
What Does Low RevPAR Mean?
If you’re seeing a lower value when you calculate RevPAR, it indicates that your property isn’t meeting its full potential. This typically means that there’s an issue with your rates, that rooms aren’t being used, or both. If your rates are competitive, but you’re still seeing issues with your RevPAR, then it might be a larger problem for the market as a whole. Conversely, low rates combined with high occupancy typically show a problem with overall pricing and business strategy. RevPAR doesn’t give a single answer, but it points to where you should investigate and how to plan a solution. Regular RevPAR analysis lets you quickly adjust and correct these issues. This might mean targeting new markets, changes to distribution channels, or adjusting to the larger market.
What Does High RevPAR Mean?
If you have a high RevPAR, then it suggests profitability, but doesn’t guarantee it. RevPAR does demonstrate that you’re doing well with both occupancy and the related pricing strategy. Likewise, it shows demand for your services even within a competitive market. That said, RevPAR is the value before operating costs and related issues are factored in. Don’t become overly complacent when you see a high score. Instead, consider the foundational components involved in the property’s operation and how they factor in. The ultimate goal is sustainability. You need profit created by optimizing your strategy around the points that RevPAR highlights.
What is a Good RevPAR?
One of the most common misconceptions is that high and good RevPAR are synonymous. In reality, what defines a good RevPAR varies as a relative value in relation to the surrounding market over time. As a general example, consider that an economy property might sit at $50 to $70. A luxury hotel in a perfect area might have values exceeding $300. What matters more is how the luxury property is doing compared to the competition, as is the case with other types. A RevPAR Index over 100% is a more solid sign of success. Especially paired with a RevPAR that shows consistent improvement, suggesting refined performance and growing market share.
Video: Calculating Revenue per Available Room (RevPAR), Occupancy Percentage %, Average Daily Rate (ADR)
RevPAR-Related KPIs
Once you calculate RevPAR metrics, you should consider the following elements to get a more comprehensive view:
- TRevPAR (Total Revenue Per Available Room): This is a broader metric whose reach encompasses more than just room revenue, as it includes spa, F&B, and many other services. For more information on TRevPAR, read “What Is TRevPar?”
- GOPPAR (Gross Operating Profit Per Available Room): A high RevPAR value can seem promising at first, but make sure to factor in the overall operating cost to determine the full profit suggested after you calculate RevPAR.
- NRevPAR (Net Revenue Per Available Room): When you subtract the fees and channel commissions from your revenue, you’ll see a larger net revenue after the costs related to acquisitions. If you want to learn more about NRevPAR, read “NRevPAR Clearly Explained!”
- RevPAG (Revenue Per Available Guest): Use revenue per available guest values to see how your guests use their money outside their rooms through a variety of other services, including personalized offerings and ancillary services.
- RevPAC (Revenue Per Available Customer): This element should be considered after you calculate RevPAR in order to find the full value of a guest over a lifetime, as it puts a priority on guest retention, including factors like multiple stays.
- RevPAM (Revenue Per Available Square Meter): This value is especially important for hotels with larger meeting spaces or retail centers as it’s a metric to show the efficiency of your property’s space utilization.

Luminita MardaleDirector of Marketing and Business Development, Vienna House“RevPAR, ADR, and Occupancy are some of the most important KPIs that help hotels to optimise revenue, especially when we have a high/low season fluctuation. Another important factor is WCR (Website Conversion Rate), which helps hotels to measure the percentage of website visitors who complete a booking. The Direct Booking Ratio (DBR) helps to see the percentage of total bookings that come directly to the website, bookings that are more profitable than reservations made via an OTA with a high commission.” Click here to read about Hotel Marketing KPI Recommendations from Hospitality Leaders. |
Alternatives to RevPAR
When you calculate RevPAR, you should also consider these additional metrics that can shed additional light on its greater meaning:
- EBITDA (Earnings Before Interest, Taxes, Depreciation, and Amortization): This value shows the larger scale of the value your property is generating independently of the requisite expenses and can help you make clear comparisons between locations.
- Average Revenue Per User (ARPU): This metric is especially important for properties that have profit-generating membership models or other features that help to track a guest’s spending to show profit per customer rather than by room.
- Revenue Flow-Through: When you calculate RevPAR you should try to both use it to improve your overall performance and use revenue flow-through to track the progress of revenue translating to profit.
- Market Penetration Index: You can use this value to highlight how RevPAR sheds light on your occupancy, as it’s a direct comparison with competitive sets that identify if performance issues are due to rate or occupancy problems.
- Rate Penetration Index: This value is similar in many ways to the Market Penetration Index; however, it’s distinct because it’s centered on ADR performance in relation to competition and separates your occupancy concerns from pricing effectiveness.
- Revenue Opportunity Index: Use Revenue Opportunity Indexes to locate and properly quantify revenue generation possibilities that you might have missed while also assisting you in the optimization of your larger revenue management strategy over various channels and segments.
Common Mistakes to Avoid When You Calculate RevPAR
Consider the following common pitfalls when you calculate RevPAR in order to get the most out of your results:
- Inconsistent Room Counts: If you don’t properly track the inventory numbers for your room over the changing seasons or when work is being done on the property, you’ll often see errors when you calculate RevPAR.
- Over-Reliance on RevPAR: When you calculate RevPAR, it should be with the understanding that it’s most valuable when considered alongside the full profit margins, remembering how discounted rates with high occupancy can reduce profit.
- Ignoring Market Segments: You should always consider the individual components that make up the market, as these segments represent opportunities for strategic revenue management.
- Short-Term Focus: You might make hasty and mistaken pricing choices if you’re reacting to short-term changes in RevPAR without considering long-term trends.
- Neglecting Competitive Context: Your RevPAR is most valuable when you compare it to both market indices, such as the RevPAR Index, and competitive sets.
- Overlooking Total Revenue: Don’t forget the contribution of additional services, room rates, and package deals when you calculate RevPAR.
The Most Used Revenue Management KPIs for Hotels
Key performance indicators (KPIs) are an essential tool for success within the hospitality industry. KPI metrics show how well your property is doing, your overall efficiency, what to expect in the future, channel contribution, market penetration, and more. The RevPAR KPI is an important metric, but it’s not the only one. You can learn about the other KPI metrics, including how to generate and use them, within the article “The Most Used Revenue Management KPIs for Hotels.”
Revenue Management Trends: Latest Developments
One significant fact should be readily apparent as you learn about how to use and calculate RevPAR metrics: data matters. The hotel industry’s infrastructure is evolving at a rapid pace thanks to new tools that can help you get the most out of different informational pools. Machine learning and AI, revenue optimization techniques, personalized pricing, and many other trends are helping people maximize profits through the optimal use of their resources. You can discover which of these recent trends would be the best fit for your business in the article “Revenue Management Trends: Latest Developments.”
Did You Like This Article about RevPAR Calculation?
You might also be interested in the following articles:
- Hotel KPIs explained: ADR, REVPAR and GOPPAR
- Top Hotel Marketing KPI Recommendations from Hospitality Leaders
- 9 Essential Hotel KPIs to Optimize Your Upsell Marketing Performance
- RevPAR versus GOPPAR
Calculate RevPAR and consider what went into it. However, do not stop there. Your RevPAR is a tool, not the final destination. Once you’ve generated it, carefully leverage it within a larger business strategy.
More Tips to Grow Your Business
Revfine.com is the leading knowledge platform for the hospitality and travel industry. Professionals use our insights, strategies, and actionable tips to get inspired, optimize revenue, innovate processes, and improve customer experience.Explore expert advice on management, marketing, revenue management, operations, software, and technology in our dedicated Hotel, Hospitality, and Travel & Tourism categories.


Leave A Comment